⚡ Introduction to the Three Black Crows Pattern
The Three Black Crows is one of the most feared and respected bearish reversal patterns in candlestick analysis 📉💀. This three-candle formation signals a dramatic shift from bullish sentiment to overwhelming bearish control, often marking the beginning of significant downtrends that can devastate unprepared bulls 🐂💥.
Named for its ominous appearance of three consecutive dark candles 🐦⬛🐦⬛🐦⬛, this pattern has earned its reputation as a harbinger of market doom. When the Three Black Crows appear after an uptrend, experienced traders take notice – and often head for the exits 🚪🏃♂️.
👁️ Visual Structure and Formation Requirements
The Three Black Crows consists of three consecutive bearish candlesticks with specific characteristics 📊:
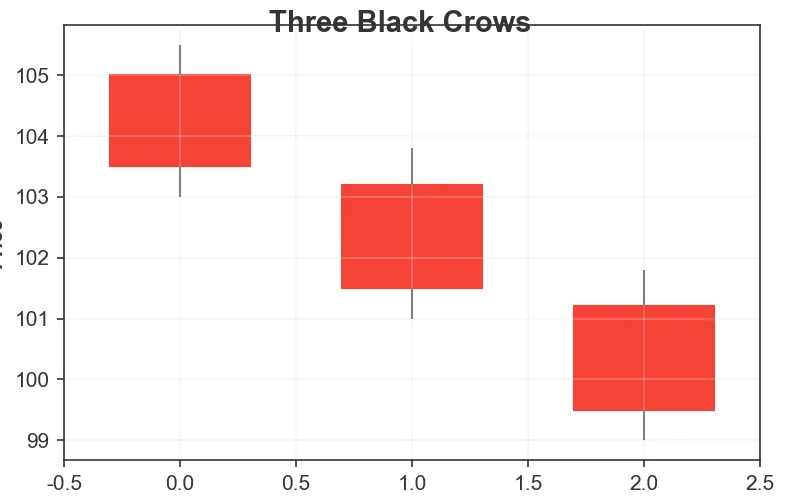
✅ Essential Formation Criteria:
- Three Consecutive Bearish Candles: Each candle must be red/black 🔴 with real bodies of substantial size 📏
- Progressive Lower Closes: Each candle closes lower than the previous candle’s close ⬇️⬇️⬇️
- Progressive Lower Opens: Each candle opens within or near the previous candle’s real body 📦
- Minimal Upper Shadows: Little to no upper wicks, showing relentless selling pressure 📉
- Established Uptrend: Must appear after a significant bullish move to be valid 📈
🎯 The Perfect Three Black Crows:
- Each candle opens near the previous day’s close 🎯
- Each candle closes near its daily low ⬇️
- Candles are roughly equal in size 📏⚖️
- No significant gaps between candles ❌🕳️
- Increasing volume on each successive candle 📊📈
🧠 Market Psychology Behind the Pattern
Understanding the psychological dynamics makes this pattern even more powerful 💭:
Day 1: The first black candle shocks bullish traders who expected the uptrend to continue. Initial selling pressure emerges, but many bulls view this as a temporary pullback and prepare to “buy the dip” 🛒📉.
Day 2: The second bearish candle confirms that something fundamental has changed. Bulls who bought the first dip are now underwater 🌊, while bears gain confidence 🐻💪. Panic hasn’t set in yet, but concern is growing 😰.
Day 3: The third consecutive bearish candle triggers widespread panic selling 😱💸. Bulls abandon their positions en masse, stop losses are triggered 🔴, and bears take complete control 🐻👑. The psychological damage is often irreversible in the short term 💀.
This three-day psychological destruction is what makes the pattern so devastatingly effective – it systematically destroys bullish confidence while emboldening bears 🔨💔.
🔄 Variations and Related Patterns
📏 Standard Three Black Crows
The classic formation with three roughly equal bearish candles showing steady, relentless selling pressure 📉⚖️.
🎯 Identical Three Black Crows
A more rare and powerful variation where all three candles are nearly identical in size and range, indicating extremely methodical selling.
🕳️ Three Black Crows with Gaps
When gaps down occur between candles, the pattern becomes even more bearish, showing accelerating panic 📉💨.
❌ Upside Tasuki Gap Failure
Sometimes the Three Black Crows develops after a failed bullish gap pattern, making the reversal even more dramatic 💥.
💼 Trading Strategies and Execution
⚡ Aggressive Entry Strategy
For experienced traders comfortable with higher risk:
- Enter short position after the second black candle closes 🔴
- Place stop loss above the high of the first candle 🛡️
- Target major support levels or use trailing stops 🎯
- Use smaller position sizes due to early entry 📏
🛡️ Conservative Entry Strategy
Lower risk approach with higher probability:
- Wait for the complete three-candle formation 🐦⬛🐦⬛🐦⬛
- Enter on the open of the fourth candle if it gaps down or opens bearish 📉
- Require volume confirmation on the third candle 📊✅
- Place stop loss above the highest high of the three-candle formation 🔴
✅ Confirmation Entry Strategy
Highest probability but potentially smaller rewards:
- Wait for a fourth bearish candle to confirm the pattern ✅
- Enter only if the fourth candle breaks below the low of the three-candle formation 📉
- Use tighter stop losses above the formation high 🛡️
- Best for risk-averse traders 😌
🛡️ Stop Loss and Risk Management
Proper risk management is crucial when trading the Three Black Crows:
- Initial Stop Loss: Place above the highest high of the three-candle formation 🔴⬆️
- Trailing Stops: Move stops down as the trade becomes profitable 📉💰
- Time Stops: Exit if no significant follow-through occurs within 5-10 trading days ⏰
- Position Sizing: Use appropriate risk per trade (typically 1-2% of account) 💰📏
- Correlation Risk: Be aware of broader market conditions that might invalidate the signal 🌍⚠️
🎯 Profit Targets and Exit Strategies
📍 Technical Target Levels
- Previous significant support levels 📉🎯
- 50% or 61.8% Fibonacci retracements of the prior uptrend 🌀
- Major moving averages (50-day, 200-day) 📈📊
- Previous swing lows 📉📍
⚡ Dynamic Exit Strategies
- Trailing Stops: Follow the downtrend with progressive stop adjustments 📉🔄
- Partial Profits: Take profits at technical levels while letting runners continue 💰🏃♂️
- Volume-Based Exits: Exit when volume starts declining significantly 📊⬇️
- Pattern-Based Exits: Close positions when bullish reversal patterns emerge 📈🔄
📊 Performance Statistics and Reliability
Historical analysis reveals the Three Black Crows’ impressive track record 📈:
- Success Rate: 78-85% when properly identified and confirmed ✅💯
- Average Decline: 10-25% from pattern completion to major support 📉📏
- Time to Target: Most significant moves occur within 10-30 trading days ⏱️
- False Signal Rate: 15-22%, mostly during strong bull markets ❌📈
- Market Dependency: More reliable in individual stocks than broad market indices 📊🎯
🌟 Optimal Trading Conditions
The Three Black Crows performs best under specific conditions 🎯:
- After Significant Uptrends: Most effective following substantial bullish moves (20%+ gains) 📈💪
- High Volume Confirmation: Increasing volume on each successive candle enhances reliability 📊⬆️
- Overbought Markets: More powerful when RSI, MACD, or other indicators show overbought conditions 📊🔥
- Earnings/News Catalysts: Often accompanied by negative fundamental developments 📰📉
- Market Distribution: Most effective during broad market distribution phases 📊📉
⚠️ Common False Signals and Avoidance
Protect yourself from false signals by watching for these warning signs 🚨:
- Low Volume Formation: Patterns forming on declining volume are less reliable 📊⬇️
- Strong Support Nearby: Avoid when major support levels are close to the pattern 🛡️📍
- Bull Market Extremes: Pattern less reliable during powerful bull market phases 📈💪
- Oversold Conditions: Be cautious when indicators already show extreme oversold readings 📊⬇️
- Gap Fills: Patterns that develop to fill previous gaps may be temporary 🕳️⏰
🔧 Integration with Other Technical Analysis
Enhance Three Black Crows signals by combining with 🛠️:
- Moving Average Analysis: More significant when breaking below key moving averages 📈📉
- Momentum Indicators: RSI divergence or MACD crossovers add confirmation 📊✅
- Support/Resistance Levels: Breaking key levels increases pattern reliability 🔨📍
- Volume Analysis: Volume patterns should confirm the selling pressure 📊📉
- Sector Analysis: Broader sector weakness enhances individual stock signals 🏢📉
🌍 Market-Specific Considerations
📈 Stock Markets
- Most reliable on individual stocks with good liquidity 💧
- Enhanced significance during earnings disappointments 📊😞
- Consider sector rotation dynamics 🔄🏢
💱 Forex Markets
- Works well on major currency pairs 💰
- Consider central bank policy implications 🏦📋
- Factor in economic data releases 📊📢
🛢️ Commodities
- Particularly effective in energy and metals ⚡🥇
- Consider supply/demand fundamentals ⚖️
- Watch for seasonal patterns 🌱❄️
🪙 Cryptocurrency
- Highly effective due to emotional trading 😱💰
- Volume confirmation is critical 📊🎯
- Consider broader crypto market sentiment 🌍💭
🎓 Advanced Trading Techniques
🔍 Multiple Timeframe Analysis
Confirm the pattern across different timeframes ⏰:
- Use daily charts for primary analysis 📊
- Confirm with weekly charts for longer-term context 📅
- Use hourly charts for precise entry timing ⏰🎯
📊 Options Strategies
Leverage the pattern with options 💼:
- Buy put options for limited risk, unlimited reward 📉💰
- Sell call spreads for income generation 💸
- Use put spreads for defined risk strategies 🎯📏
🛡️ Portfolio Hedging
Use the pattern for portfolio protection 🔒:
- Hedge long positions when pattern appears on market indices 📊🛡️
- Reduce position sizes in affected sectors 📏🏢
- Increase cash positions during broad market patterns 💰📈
🏆 Conclusion
The Three Black Crows stands as one of the most reliable and devastating bearish reversal patterns in technical analysis. Its power lies not just in its high success rate, but in its ability to signal the beginning of significant, sustained downtrends that can last weeks or months 📉⏰.
For traders who master this pattern, it provides exceptional opportunities to profit from market reversals 💰 while protecting portfolios from major declines 🛡️. The key to success lies in proper identification 🔍, confirmation ✅, and disciplined risk management 🎯.
Remember: when the Three Black Crows appear, they’re usually harbingers of significant trouble ahead. Smart traders heed their warning and position themselves accordingly. Whether you’re looking to profit from the decline or protect existing positions, this pattern demands respect and immediate attention 👀.
Master the Three Black Crows, and you’ll have one of the most powerful bearish signals in your trading arsenal – a signal that has consistently warned traders of impending market doom for centuries.
📒Full Candlestick Pattern Guide
- 🕐 Learn Candlestick Patterns Fast – Spot Profitable Signals in 5 Minutes
- ✅ Candlestick Patterns That Work – Highest Success Rate Signals
- 🏯 Japanese Candlestick Patterns: History and Psychology
- 🛠️ Candlestick Patterns for Beginners – Your Complete Starter Guide
- 🤿 How to Read Candlestick Patterns – Components Deep Dive
Disclaimer: This is educational content only, based on common investment and trading industry knowledge. This is not financial advice, and we are not financial advisors. Always speak with a professional financial advisor before investing. Use of this content is at your own risk.