Shooting Star Candlestick Pattern: Complete Trading Guide 📊
The Shooting Star is the cosmic warning shot of candlestick patterns – it streaks across bull market skies like a meteor, beautiful to watch but often signaling that wishes are about to turn into nightmares! 🌠💥

- Pattern Type: Single Candle
- Direction: Bearish (the dream crusher of rallies)
- Alternative Names: Inverted Hammer (in uptrend context), Star Shooter
- Reliability Score: 0.57 (above average when properly confirmed)
- Win Rate: Moderate (but devastating when it works)
- Best For: Catching the peak of unsustainable rallies
📋 Pattern Classifications
- Pattern Type: Single Candle Pattern
- Market Direction: Bearish Reversal Signal
- Pattern Category: Reversal Pattern
- Pattern Family: Star Family
- Reversal vs Continuation: Strong Reversal Signal
- Best Timeframes: Daily, Weekly Charts
- Volume Dependency: Higher volume amplifies the bearish message
- Optimal Prior Trend: Uptrend (the steeper the climb, the bigger the fall)
📊 What Does It Look Like?
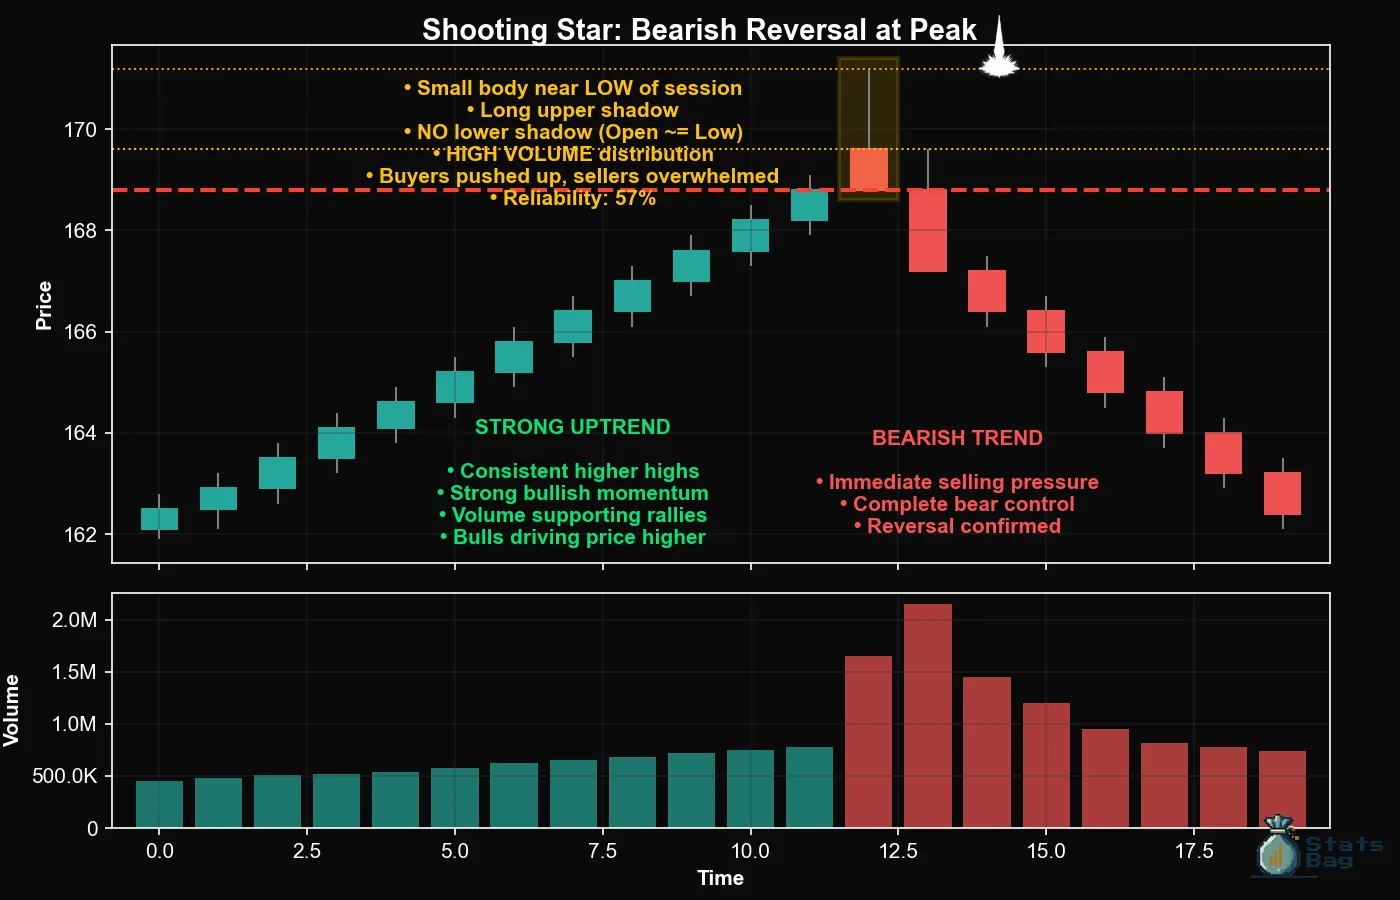
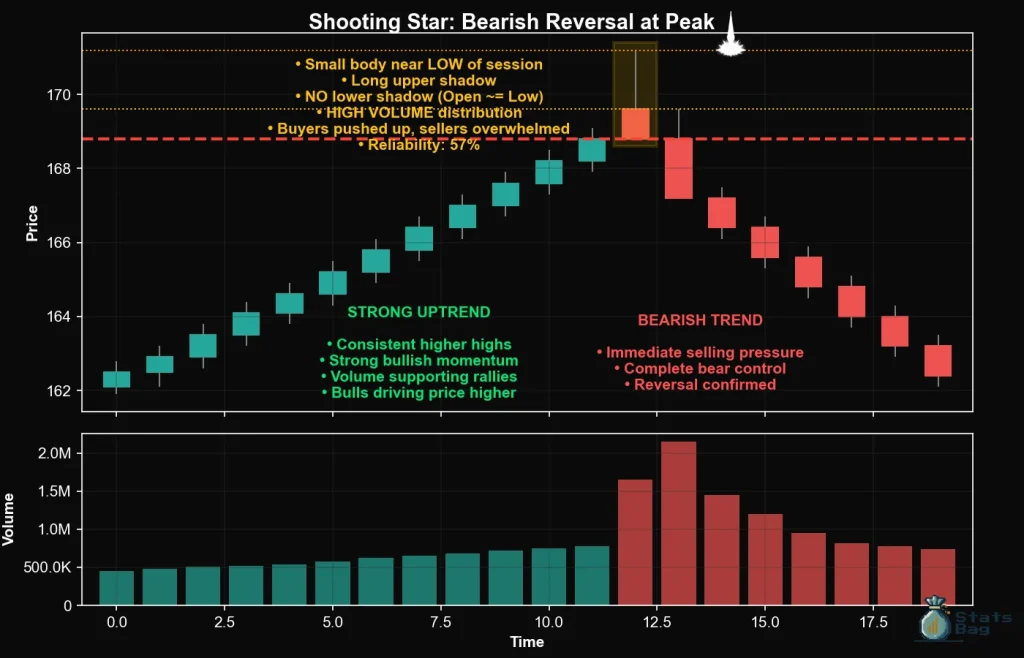
Picture a shooting star blazing across the night sky – that’s your visual! It has a small body at the bottom of the range with a long upper shadow reaching toward the heavens, like buyers made a desperate attempt to touch the stars but crashed back to earth. ⭐🔥

Formation Criteria:
- Small real body positioned at the lower end of the trading range
- Long upper shadow (at least 2-3 times the body length)
- Little to no lower shadow (minimal downside wick)
- Body color matters less than structure – red slightly more bearish
- Must appear after a sustained uptrend or at resistance levels
Visual Key: If it looks like a lollipop that someone turned upside down, with the stick pointing skyward, you’ve spotted your Shooting Star! 🍭⬆️
🧠 Market Psychology
The Shooting Star tells a tragic tale of failed ambition that plays out like this:
- Opening: Bulls start the session with confidence and optimism
- The Launch: Buyers aggressively push prices to new heights
- The Resistance: Sellers emerge in force at elevated levels
- The Crash: Bears completely overwhelm bulls, crushing prices back down!
What This Really Means:
- Bulls ran out of ammunition at higher levels
- Strong selling pressure materialized when price reached new highs
- The rally was unsustainable and overextended
- Smart money likely used the strength to distribute shares
- Previous uptrend momentum is seriously questioned
📈 Trading Strategy
⚡ Entry Strategy:
The Shooting Star is your “altitude sickness” warning – prices climbed too high, too fast!
- Confirmation Required: Wait for next candle to close below Shooting Star’s body
- Resistance Levels: Most effective at major resistance or psychological levels
- Volume Analysis: High volume on formation + confirmation = powerful signal
🎯 Entry Rules:
- Conservative Short: Sell when next candle closes below Shooting Star’s low
- Aggressive Short: Short on break below Shooting Star’s body with volume
- Scale-In Method: Half position on confirmation, half on bounce failure
- Best Setups: After gap-ups or at round psychological numbers
💰 Profit Targets:
- Quick Scalp: 1:2 risk-reward to first support
- Swing Target: Previous breakout level or major support
- Trend Reversal: Trail stops if downtrend momentum develops
📚 Key Takeaways
- 🌠 It’s a bearish reversal warning – shooting stars burn out!
- 📍 Location determines impact – resistance levels maximize effectiveness
- ⏰ Always wait for confirmation – never short the pattern alone
- 📊 Volume amplifies the signal – high volume = high conviction selling
- 🎯 Works best after strong rallies – overextension creates opportunity
Bottom Line: When you see a Shooting Star after a rally, it’s like watching Icarus fly too close to the sun – beautiful, but destined to fall! 🌠📉
📒Full Candlestick Pattern Guide
- 🕐 Learn Candlestick Patterns Fast – Spot Profitable Signals in 5 Minutes
- ✅ Candlestick Patterns That Work – Highest Success Rate Signals
- 🏯 Japanese Candlestick Patterns: History and Psychology
- 🛠️ Candlestick Patterns for Beginners – Your Complete Starter Guide
- 🤿 How to Read Candlestick Patterns – Components Deep Dive
Disclaimer: This is educational content only, based on common investment and trading industry knowledge. This is not financial advice, and we are not financial advisors. Always speak with a professional financial advisor before investing. Use of this content is at your own risk.