Dragonfly Doji Candlestick Pattern: Complete Trading Guide 📊
The Dragonfly Doji is the bullish superhero of the Doji family – it’s like watching buyers stage an epic comeback from the depths of despair! 🐉✨

- Pattern Type: Single Candle
- Direction: Bullish (the phoenix rising!)
- Alternative Names: Rickshaw Man (Japanese), Umbrella Doji
- Reliability Score: 0.50 (solid 50/50, but context makes it shine)
- Win Rate: High (when it works, it really works!)
- Best For: Spotting bullish reversals at support levels
📋 Pattern Classifications
- Pattern Type: Single Candle Pattern
- Market Direction: Bullish Reversal Signal
- Pattern Category: Reversal Pattern
- Pattern Family: Doji Family
- Reversal vs Continuation: Strong Reversal Signal
- Best Timeframes: Daily, Weekly Charts
- Volume Dependency: Higher volume significantly strengthens signal
- Optimal Prior Trend: Downtrend (the more beaten down, the better!)
📊 What Does It Look Like?
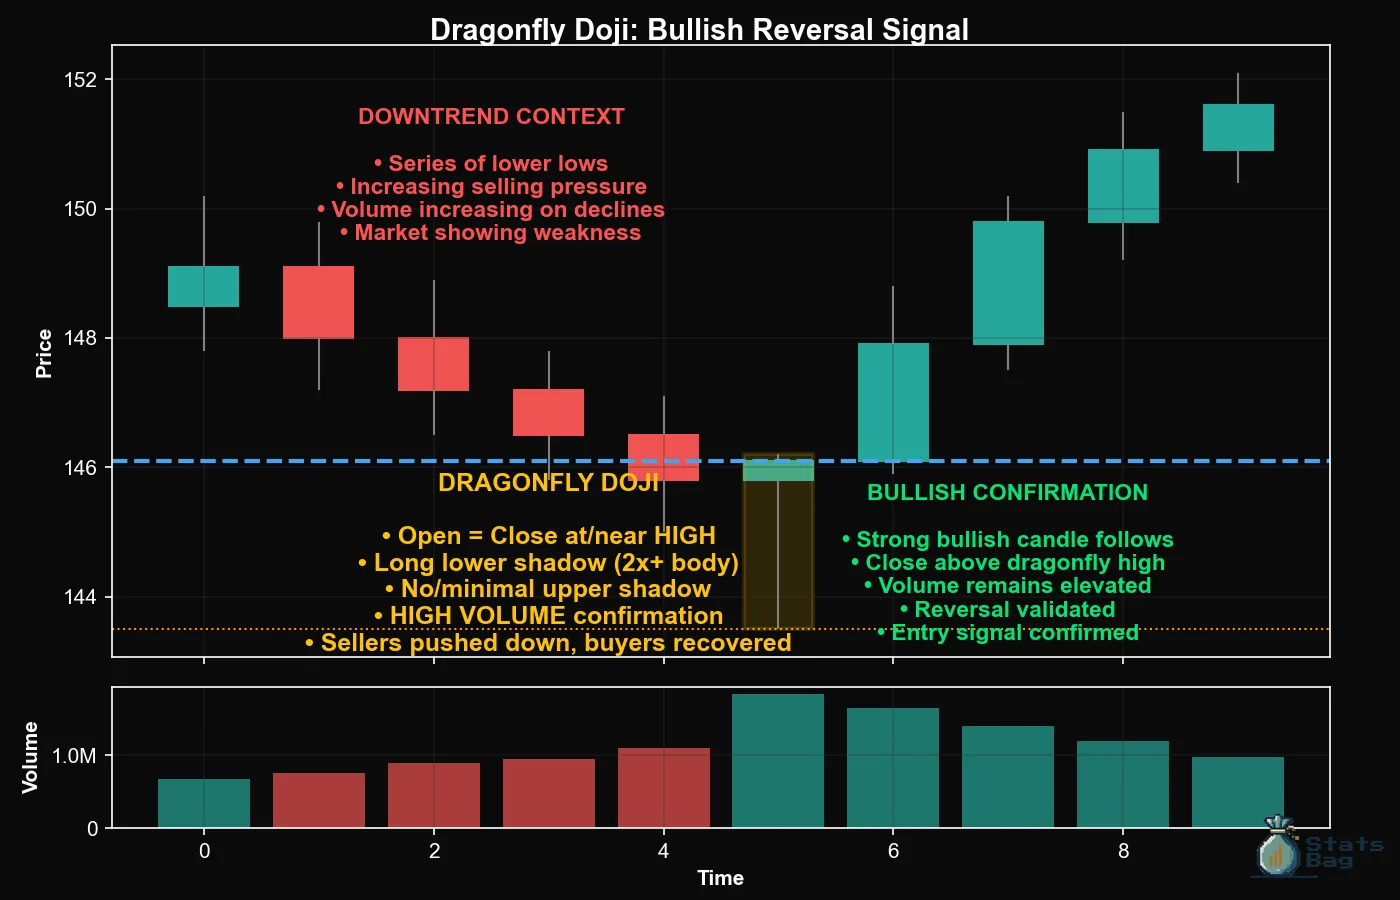
Picture a dragonfly with its wings spread wide at the bottom – that’s exactly what this pattern looks like! The open, close, and high are all clustered at the top, while a long lower shadow extends downward like a dragonfly’s tail. 🪰

Formation Criteria:
- Open, close, and high prices are virtually identical (at the session high)
- Long lower shadow (at least 2-3 times the tiny body)
- No upper shadow (or extremely minimal)
- The longer the lower shadow, the stronger the bullish signal
- Works best when appearing at or near support levels
Visual Key: If you can draw a line across the top and it touches open, close, and high – you’ve found your dragonfly! 🎯
🧠 Market Psychology
The Dragonfly Doji tells a dramatic comeback story that unfolds like this:
- Opening: The session starts with some selling pressure (or neutral sentiment)
- The Plunge: Bears attack hard, driving prices significantly lower
- The Battle: Bulls refuse to surrender and start fighting back
- The Victory: Buyers completely overwhelm sellers, pushing price back to the highs!
What This Really Means:
- Sellers exhausted their ammunition at lower levels
- Strong buying support emerged when price hit the lows
- Bulls demonstrated they’re ready to take control
- The longer shadow = the more dramatic the buyer intervention
- Previous downtrend momentum is seriously questioned
📈 Trading Strategy
⚡ Entry Strategy:
The Dragonfly Doji is your “buyers are back in town” signal, but patience pays off big time!
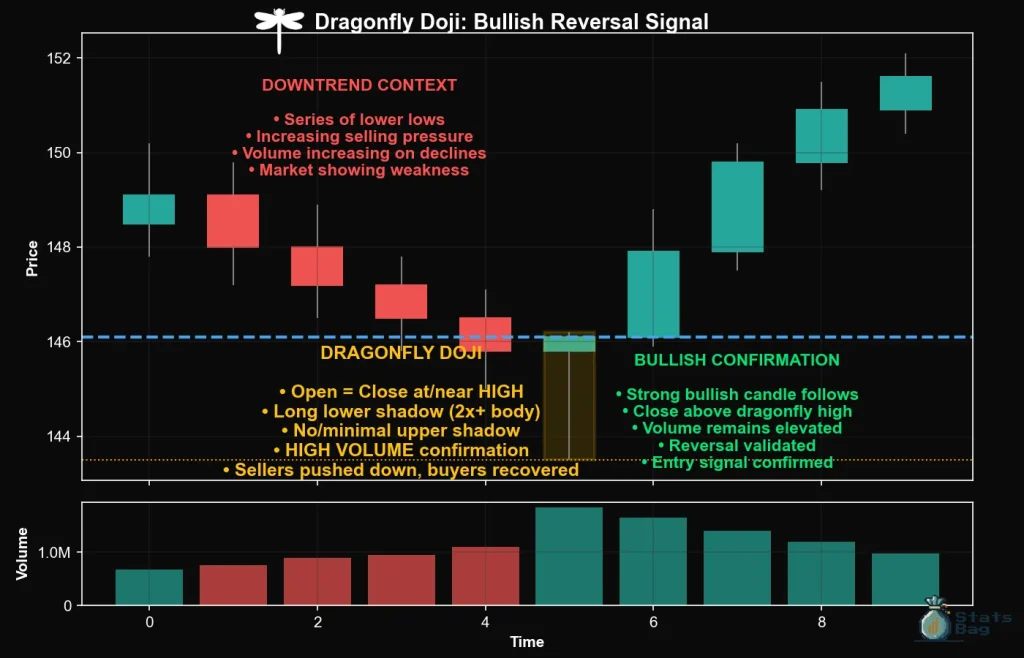
- Confirmation First: Wait for next candle to close above the Dragonfly’s high
- Support Check: Best when appearing at key support, previous resistance, or round numbers
- Volume Validation: Higher volume on the Dragonfly = stronger reversal signal
🎯 Entry Rules:
- Conservative Entry: Buy when next candle closes above Dragonfly high with volume
- Aggressive Entry: Buy on break above Dragonfly high intraday
- Scale-In Method: Half position on confirmation, half on pullback test
- Best Setups: After 3+ red candles or at major support levels
🛑 Stop Loss Placement:
- Standard Stop: Just below the Dragonfly’s low (the shadow tip)
- Tight Stop: Below the midpoint of the lower shadow
- Wide Stop: Below the nearest support level for swing trades
💰 Profit Targets:
- Quick Profit: 1:2 risk-reward to nearby resistance
- Swing Target: Previous significant high or resistance level
- Trend Reversal: Hold with trailing stops if uptrend develops
⚠️ Common Pitfalls
Don’t Fall Into These Dragonfly Traps:
- ❌ Ignoring the Prior Trend: Dragonflies in uptrends are just pullbacks, not reversals!
- ❌ Jumping In Without Confirmation: Wait for that next candle to validate the signal
- ❌ Missing the Volume Component: Low volume Dragonflies often fail
- ❌ Poor Location Timing: Random Dragonflies mid-trend are usually noise
- ❌ Oversized Positions: Even good signals need proper risk management
🚨 False Signal Warning: In strong downtrends, one Dragonfly might just be a temporary pause. Look for multiple confirmations!
🔍 Pro Tips
Level Up Your Dragonfly Game:
- 🕐 Time Your Entry: Best results on daily/weekly charts during oversold conditions
- 📍 Location Is Everything: 50-day MA, major support, or Fibonacci levels = prime spots
- 🔗 Combine With Oscillators: RSI below 30 + Dragonfly = powerful combo
- 📊 Multiple Timeframes: Daily Dragonfly + weekly oversold = home run setup
- 💪 Shadow Length Matters: Longer shadows = stronger buying pressure evidence
Advanced Recognition Tips:
- Perfect Dragonfly: Identical open/close/high with 3:1 shadow ratio
- Near-Perfect Counts: Small upper shadow still qualifies if lower shadow dominates
- Gap Dragonflies: Even more powerful when gapping down then recovering
📚 Key Takeaways
Remember These Dragonfly Essentials:
- 🐉 It’s a bullish reversal signal – buyers fought back and won!
- 📍 Location determines strength – support levels are where it shines
- ⏰ Always confirm with next candle – patience prevents false signals
- 📊 Volume amplifies the signal – high volume = high conviction
- 📈 Works best after declines – the beaten down become the comeback kings
- 🎯 Risk management is crucial – even great patterns can fail
Bottom Line: The Dragonfly Doji is like watching a boxer get knocked down, then spring back up swinging. When you see this pattern at key support levels with volume, buyers are sending a clear message: “We’re not going down without a fight!” 💪🚀
Trade smart, and may your Dragonflies lift your portfolio to new heights! 🐉✨
📒Full Candlestick Pattern Guide
- 🕐 Learn Candlestick Patterns Fast – Spot Profitable Signals in 5 Minutes
- ✅ Candlestick Patterns That Work – Highest Success Rate Signals
- 🏯 Japanese Candlestick Patterns: History and Psychology
- 🛠️ Candlestick Patterns for Beginners – Your Complete Starter Guide
- 🤿 How to Read Candlestick Patterns – Components Deep Dive
Disclaimer: This is educational content only, based on common investment and trading industry knowledge. This is not financial advice, and we are not financial advisors. Always speak with a professional financial advisor before investing. Use of this content is at your own risk.