
🎯 Doji Candlestick Pattern: Complete Trading Guide
The Doji is the ultimate indecision candle – it’s like the market’s way of saying “I honestly have no clue what to do next!” 🤷♂️

- Alternative Names: Cross
- Pattern Type: Single Candle
- Direction: Neutral (the Switzerland of candlesticks)
- Reliability Score: 0.51 (slightly better than a coin flip!)
- Win Rate: Moderate
- Best For: Spotting potential reversals and market uncertainty
📋 Pattern Classifications
- Pattern Type: Single Candle Pattern
- Market Direction: Neutral Direction Signal
- Pattern Category: Indecision Pattern
- Pattern Family: Doji Family
- Reversal vs Continuation: Potential Reversal Signal
- Best Timeframes: Daily, Weekly Charts
- Volume Dependency: Higher volume strengthens signal
📊 What Does It Look Like?
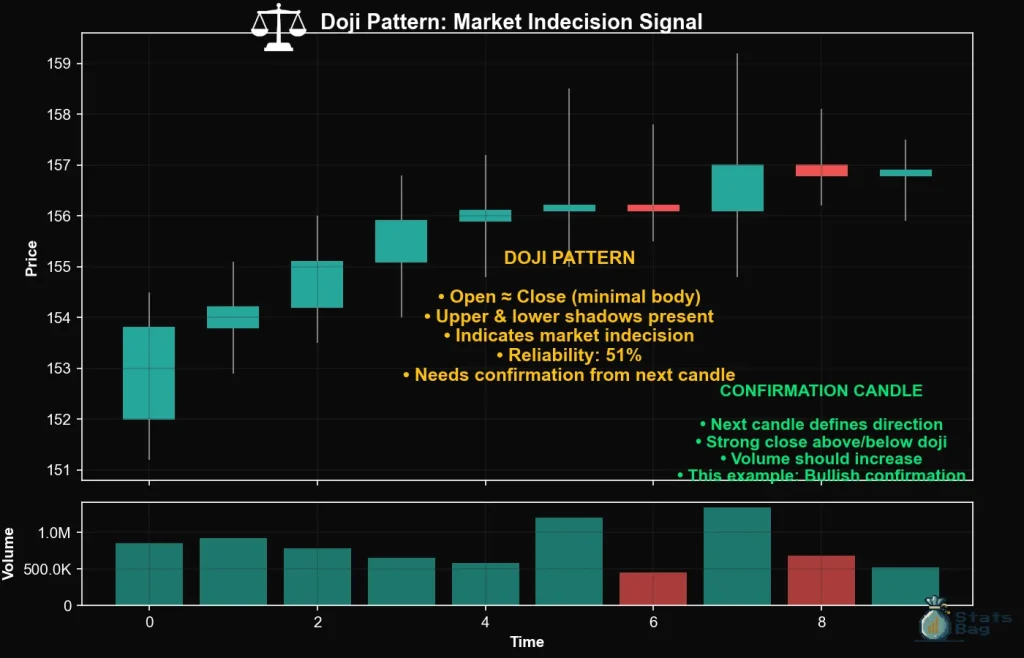
Picture this: a candle where the open and close prices are virtually identical. The result? A super skinny body (sometimes just a thin line) with shadows that can vary from tiny to dramatic. 📏

Formation Criteria:
- Open and close prices are extremely close (within 0.1% is ideal)
- Upper and/or lower shadows can be any length
- The smaller the body, the stronger the indecision signal
- Color doesn’t matter much – it’s all about that tiny body!
Pro Tip: In fast-moving markets, even a small body relative to recent volatility can qualify as a Doji. Context is king! 👑
🧠 Market Psychology
The Doji tells an epic story of market indecision that unfolds like this:
- Opening Bell: Traders start with some sentiment (bullish or bearish)
- Mid-Session Battle: Bulls and bears duke it out, prices swing up and down
- Closing Time: After all that drama… we end up RIGHT back where we started! 🔄
What This Really Means:
- Previous trend momentum is exhausting
- Neither buyers nor sellers can maintain control
- The market is taking a “breather” and reassessing
- A potential trend change might be brewing (but needs confirmation!)
📈 Trading Strategy
⚡ Entry Strategy:
Don’t jump in immediately! The Doji is a warning signal, not a green light. Here’s how to trade it properly:
- Wait for Confirmation: Look for the next candle to show clear direction
- Context Check: Is this appearing after a strong trend? That’s when Dojis shine!
- Volume Analysis: Higher volume = stronger indecision signal
🎯 Entry Rules:
- Bullish Setup: Doji at support + next candle closes above Doji high
- Bearish Setup: Doji at resistance + next candle closes below Doji low
- Position Size: Start smaller – indecision patterns need respect!
🛑 Stop Loss Placement:
- Conservative: Opposite side of the Doji’s full range
- Aggressive: Middle of the Doji body (for tight risk management)
- Dynamic: Use previous support/resistance levels nearby
💰 Profit Targets:
- Quick Scalp: 1:1 risk-reward ratio
- Swing Trade: Next major support/resistance level
- Trend Reversal: Use trailing stops if momentum continues
⚠️ Common Pitfalls
Don’t Fall Into These Doji Traps:
- ❌ Jumping In Too Early: A Doji alone is NOT a trading signal!
- ❌ Ignoring Market Context: Dojis in sideways markets are often noise
- ❌ Fighting the Overall Trend: One Doji won’t reverse a strong trend
- ❌ Using Oversized Positions: Indecision = uncertainty = smaller size!
- ❌ Expecting Perfect Dojis: Real markets are messy – small bodies count too
🚨 False Signal Warning: In low-volume or holiday trading, Dojis lose their predictive power. Always check the volume!
🔍 Pro Tips
Level Up Your Doji Game:
- 🕐 Timing Matters: Dojis work best on daily charts and longer timeframes
- 📍 Location, Location, Location: At key support/resistance levels = gold!
- 🔗 Combine With Indicators: RSI divergence + Doji = powerful combo
- 📊 Multiple Timeframes: Check if the weekly chart shows indecision too
- 🌟 Star Patterns: Look for Doji in Evening/Morning Star formations
Advanced Pattern Recognition:
- Dragonfly Doji: Long lower shadow = bullish potential
- Gravestone Doji: Long upper shadow = bearish potential
- Four Price Doji: All prices identical = ultra-rare indecision
📚 Key Takeaways
Remember These Doji Essentials:
- 🎭 It’s an indecision pattern – neither bullish nor bearish alone
- ⏰ Always wait for confirmation before entering trades
- 📊 Context is everything – location and prior trend matter hugely
- 🎚️ Size your positions appropriately – uncertainty = smaller risk
- 🔄 Best at potential reversal points after sustained trends
- 📈 Moderate reliability means good risk management is crucial
Bottom Line: The Doji is like a traffic light turning yellow – it’s telling you to slow down, pay attention, and prepare for a potential change in direction. Master this signal, and you’ll avoid many false moves while catching some fantastic reversals! 🎯
Happy trading, and may your Dojis lead to profitable reversals! 🚀
📒Full Candlestick Pattern Guide
- 🕐 Learn Candlestick Patterns Fast – Spot Profitable Signals in 5 Minutes
- ✅ Candlestick Patterns That Work – Highest Success Rate Signals
- 🏯 Japanese Candlestick Patterns: History and Psychology
- 🛠️ Candlestick Patterns for Beginners – Your Complete Starter Guide
- 🤿 How to Read Candlestick Patterns – Components Deep Dive
Disclaimer: This is educational content only, based on common investment and trading industry knowledge. This is not financial advice, and we are not financial advisors. Always speak with a professional financial advisor before investing. Use of this content is at your own risk.