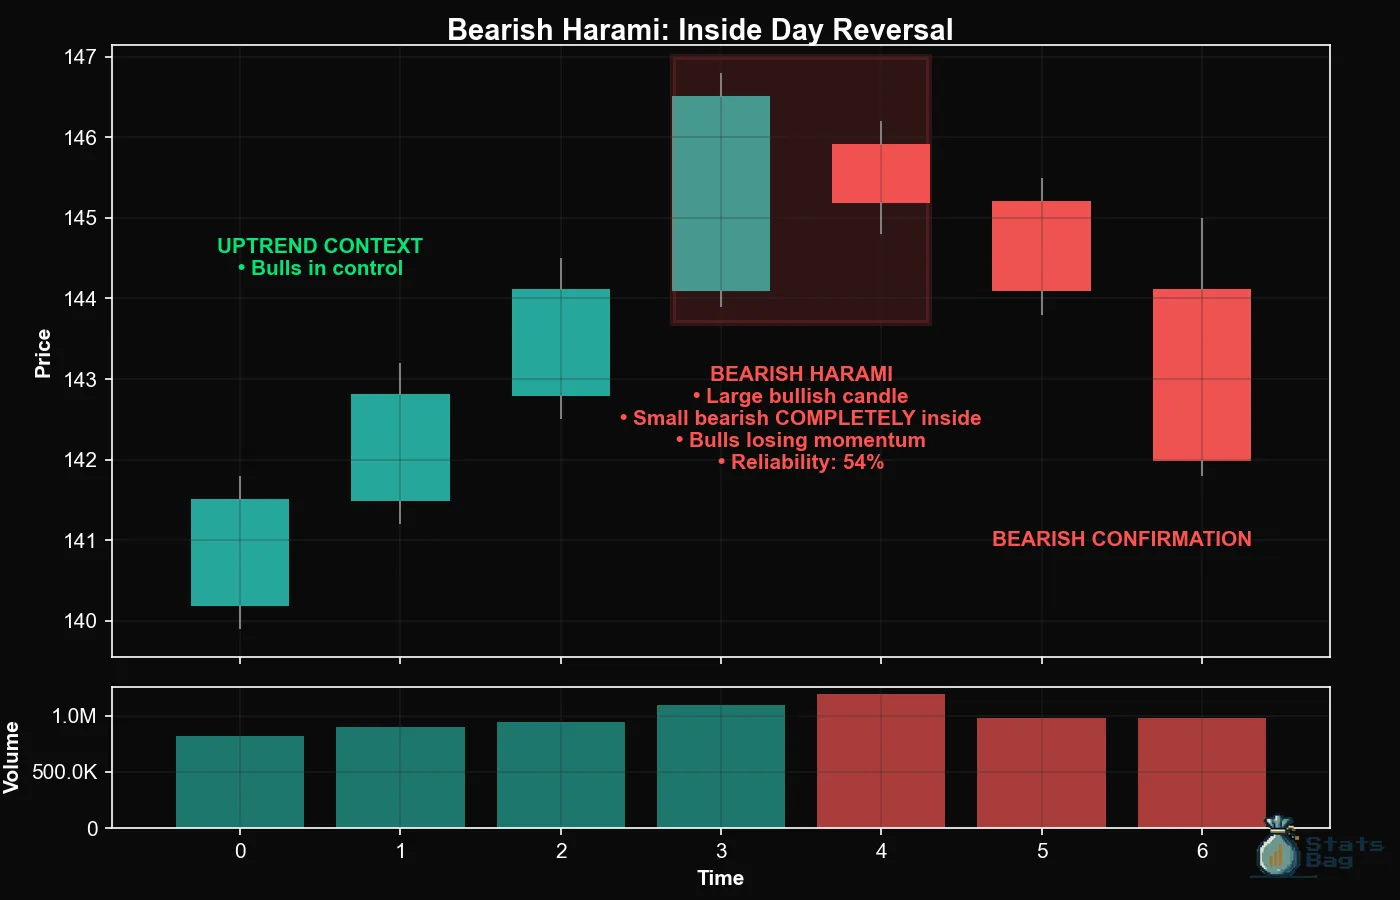
🎯 What is the Bearish Harami Pattern?
The Bearish Harami is a powerful two-candlestick reversal pattern that signals the potential end of an uptrend 📈➡️📉. This pattern gets its name from the Japanese word “harami,” which means “pregnant,” as the second candle appears to be contained within the body of the first candle, resembling a pregnant woman 🤰.
When you spot a Bearish Harami pattern at the top of an uptrend, it’s time to pay attention 👀. This pattern represents a significant shift in market sentiment from bullish optimism to bearish caution, making it one of the most reliable reversal signals in technical analysis 🔄.
👁️ Visual Characteristics of the Bearish Harami
The Bearish Harami consists of two distinct candles that tell a story of changing market dynamics 📊:
- First Candle: A large bullish (green/white) candle 🟢 that continues the prevailing uptrend with strong buying pressure 💪
- Second Candle: A smaller bearish (red/black) candle 🔴 whose entire body is contained within the real body of the first candle 📦

The key visual element is the containment – the second candle’s body must be completely engulfed by the first candle’s body. This creates a distinctive “inside” pattern that immediately catches the eye of experienced traders 👨💼.
✅ Formation Criteria and Recognition
To properly identify a valid Bearish Harami pattern, ensure these criteria are met 📋:
- Prior Uptrend: The pattern must occur during an established upward price movement 📈
- Large First Candle: The initial candle should show strong bullish momentum with a substantial real body 💪
- Contained Second Candle: The second candle’s entire real body fits within the first candle’s real body 🎯
- Color Contrast: The second candle should be bearish (opposite color to the first) ⚫⚪
- Gap Not Required: Unlike some patterns, gaps between candles are not necessary ❌🕳️
🧠 Market Psychology Behind the Pattern
Understanding the psychology behind the Bearish Harami helps you appreciate why it’s such an effective reversal signal 💭:
Day 1: Bulls are in complete control 🐂💪, driving prices significantly higher. Optimism peaks as buyers aggressively accumulate positions, creating the large bullish candle 🚀.
Day 2: Market sentiment begins to shift 🔄. Despite opening near the previous day’s high, selling pressure emerges 📉. Bears enter the market 🐻 while bulls lose confidence, resulting in a smaller, contained bearish candle 😰.
This psychological shift from aggressive buying to tentative selling often marks the beginning of a larger reversal, as smart money begins to take profits 💰 and contrarian traders prepare for a downward move 📉.
💼 Trading Strategies and Execution
🎯 Entry Strategy
The most effective approach is to wait for confirmation before entering a short position. Consider entering when:
- The next candle closes below the low of the Harami pattern ⬇️
- Volume increases on the confirmation candle 📊📈
- Supporting indicators (RSI, MACD) show bearish divergence 📉📊
🛡️ Stop Loss Placement
Place your stop loss above the high of the first (larger) candle in the Harami pattern 🔴. This provides adequate protection while accounting for normal market volatility 🌊.
🎯 Profit Targets
Target key support levels 📍, previous swing lows 📉, or use a risk-reward ratio of at least 1:2 ⚖️. In trending markets, the pattern can signal the beginning of significant reversals 🔄.
📊 Reliability and Performance Metrics
The Bearish Harami demonstrates moderate to good reliability when proper confirmation is used 📈:
- Success Rate: Approximately 60-65% when confirmed ✅
- Best Timeframes: Daily and 4-hour charts for swing trading ⏰
- Volume Dependency: Higher volume on formation days increases reliability 📊⬆️
- Market Conditions: Most effective in trending rather than ranging markets 📈📉
⚠️ Common False Signals and How to Avoid Them
Like any technical pattern, the Bearish Harami can produce false signals. Avoid these common pitfalls 🕳️:
- Weak Prior Trend: Pattern requires a strong uptrend to be significant 📈💪
- No Confirmation: Never trade on the pattern alone; wait for confirmation ⏳
- Low Volume: Patterns forming on low volume are less reliable 📊⬇️
- Market Context: Avoid trading against major support levels or during earnings announcements 📢
🔥 Advanced Tips for Professional Traders
Enhance your Bearish Harami trading with these professional techniques 🎓:
- Multiple Timeframe Analysis: Confirm the pattern on higher timeframes 🔍📊
- Fibonacci Confluence: Look for patterns near key Fibonacci retracement levels 🌀
- Volume Profile: Check for high-volume nodes that might act as support 📊🎯
- Sector Rotation: Consider broader market trends and sector rotation 🔄🏢
🏆 Conclusion
The Bearish Harami pattern represents a critical shift in market sentiment that can signal profitable reversal opportunities 💰. By understanding its formation, psychology, and proper trading techniques, you can add this powerful pattern to your technical analysis toolkit 🧰.
Remember: successful pattern trading requires patience ⏳, confirmation ✅, and proper risk management 🛡️. The Bearish Harami is most effective when combined with other technical indicators and fundamental analysis 📊📈.
See Also: Bearish Harami, Tweezers Top
📒Full Candlestick Pattern Guide
- 🕐 Learn Candlestick Patterns Fast – Spot Profitable Signals in 5 Minutes
- ✅ Candlestick Patterns That Work – Highest Success Rate Signals
- 🏯 Japanese Candlestick Patterns: History and Psychology
- 🛠️ Candlestick Patterns for Beginners – Your Complete Starter Guide
- 🤿 How to Read Candlestick Patterns – Components Deep Dive
Disclaimer: This is educational content only, based on common investment and trading industry knowledge. This is not financial advice, and we are not financial advisors. Always speak with a professional financial advisor before investing. Use of this content is at your own risk.